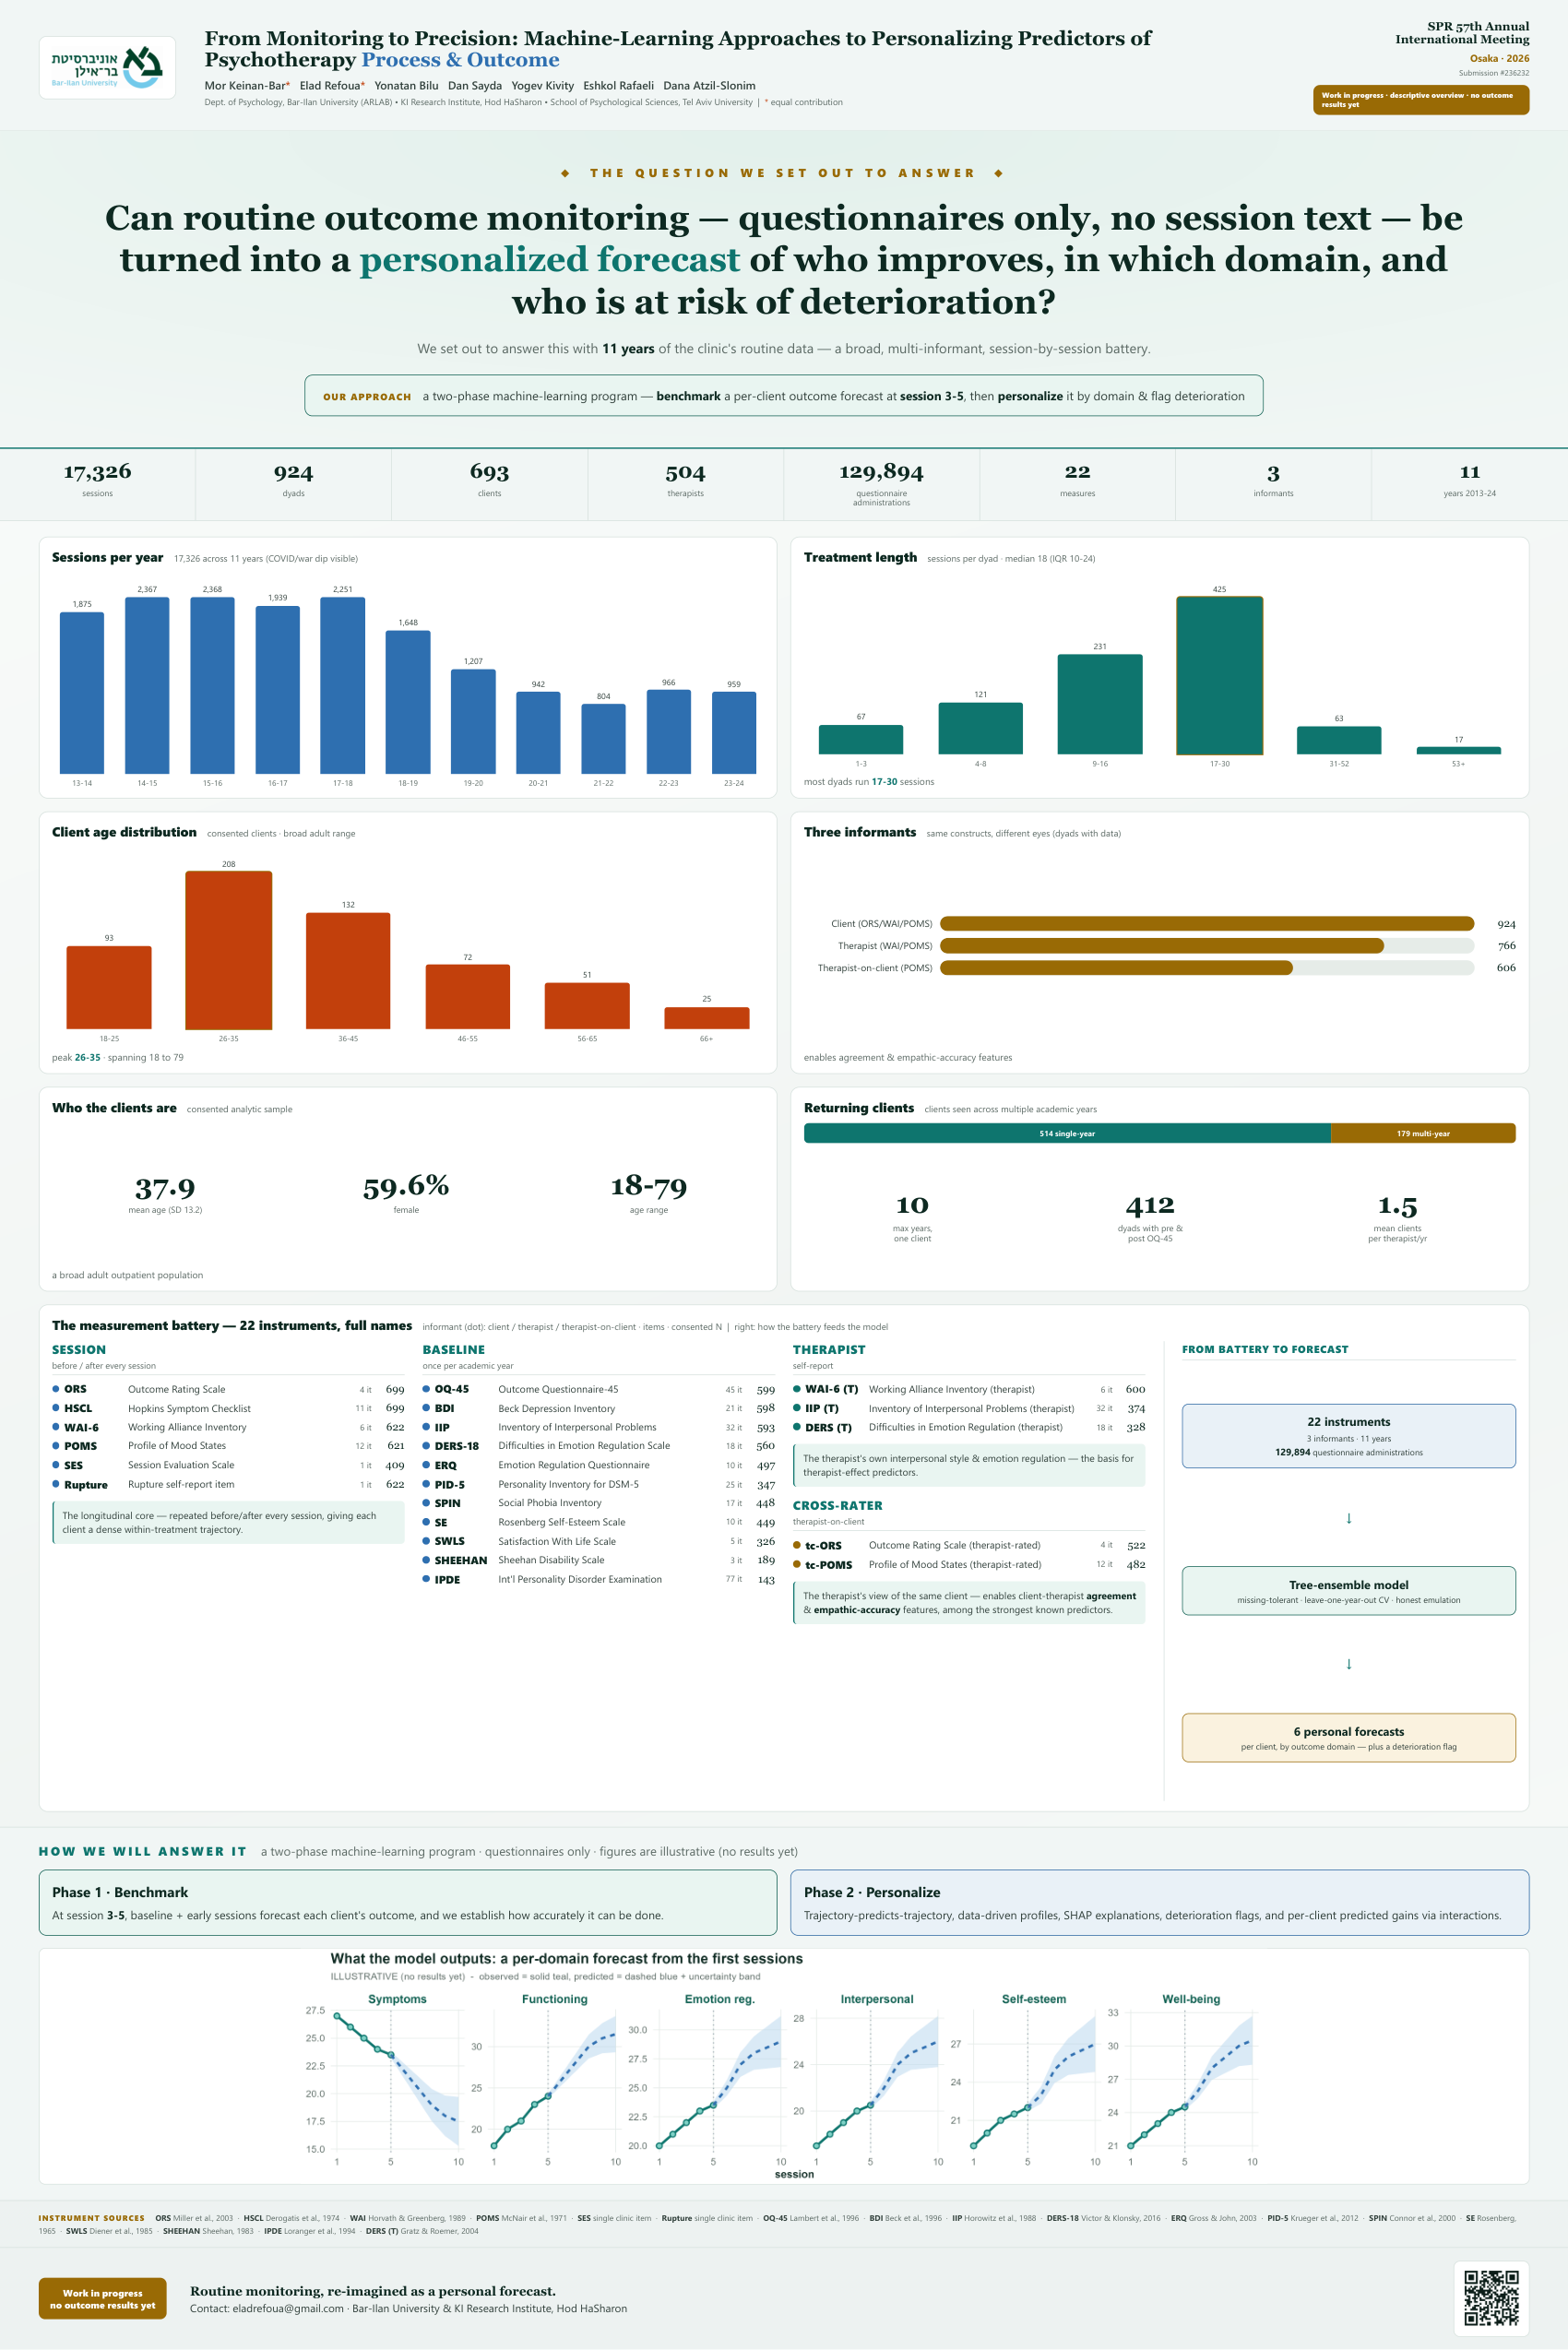
1 Forecast chart hero + compact plan
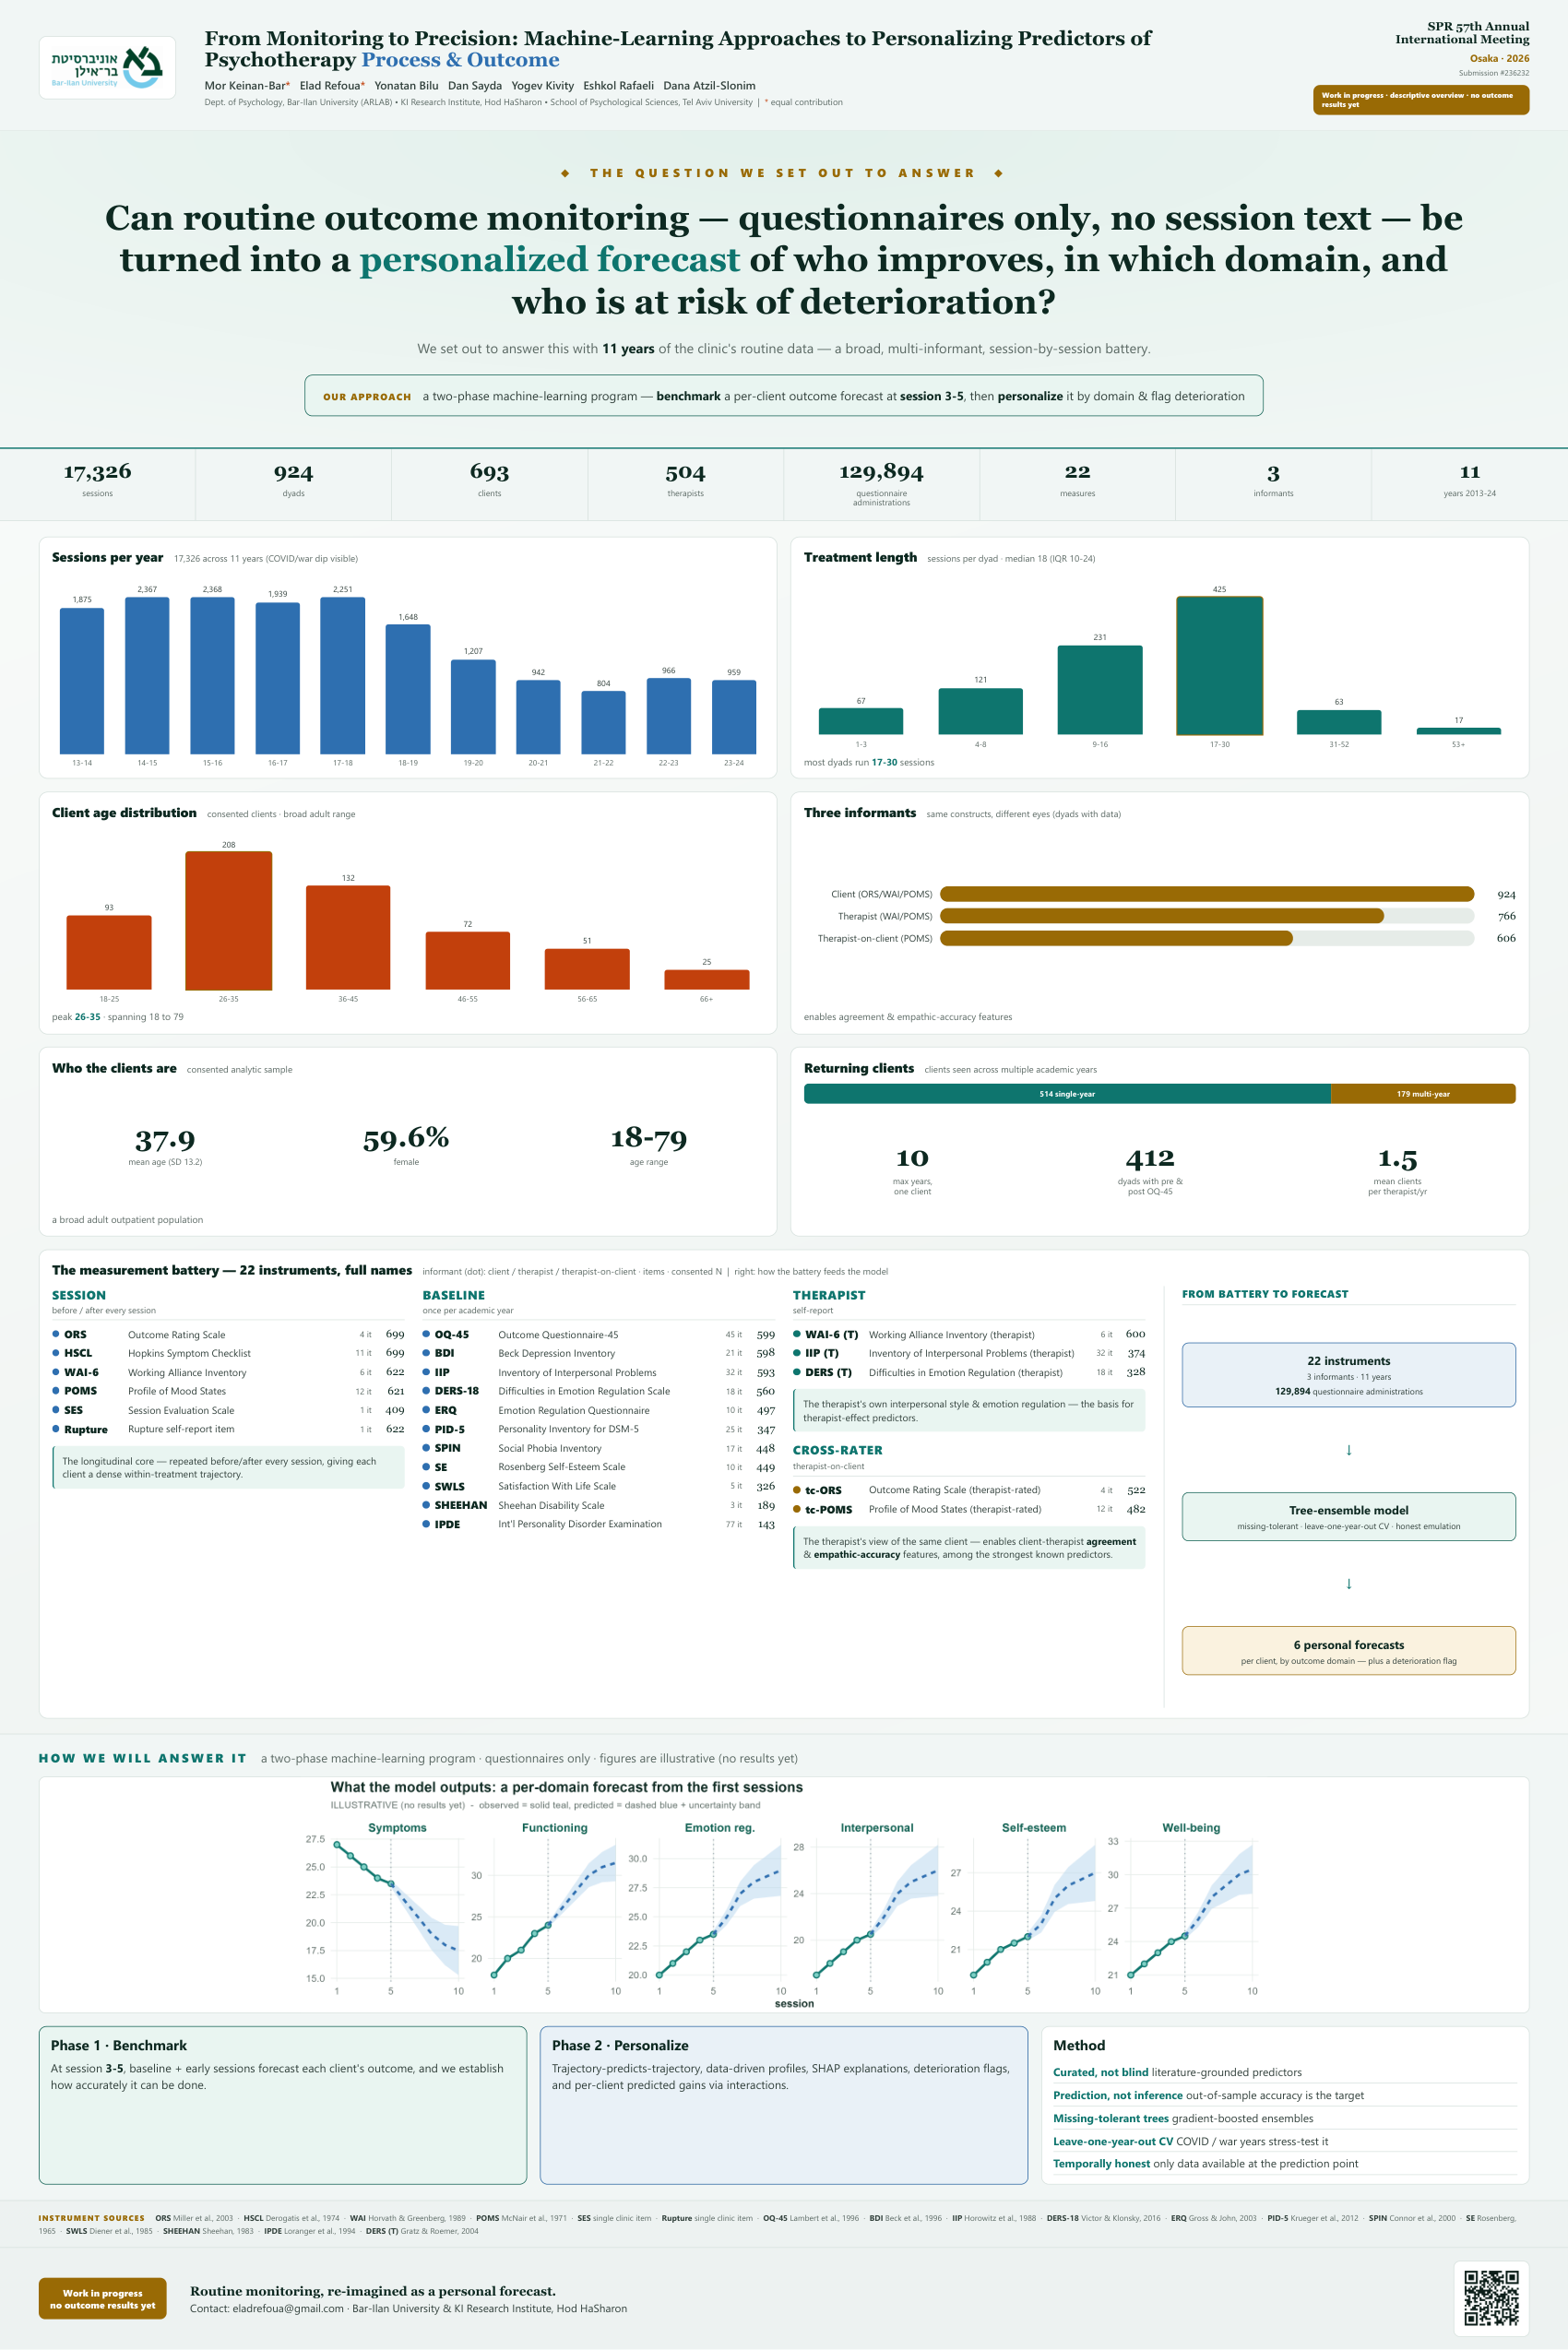
6-panel forecast chart (illustrative): observed early sessions -> predicted trajectory per domain, compact plan below.
2 Forecast + predicted-gains, side by side
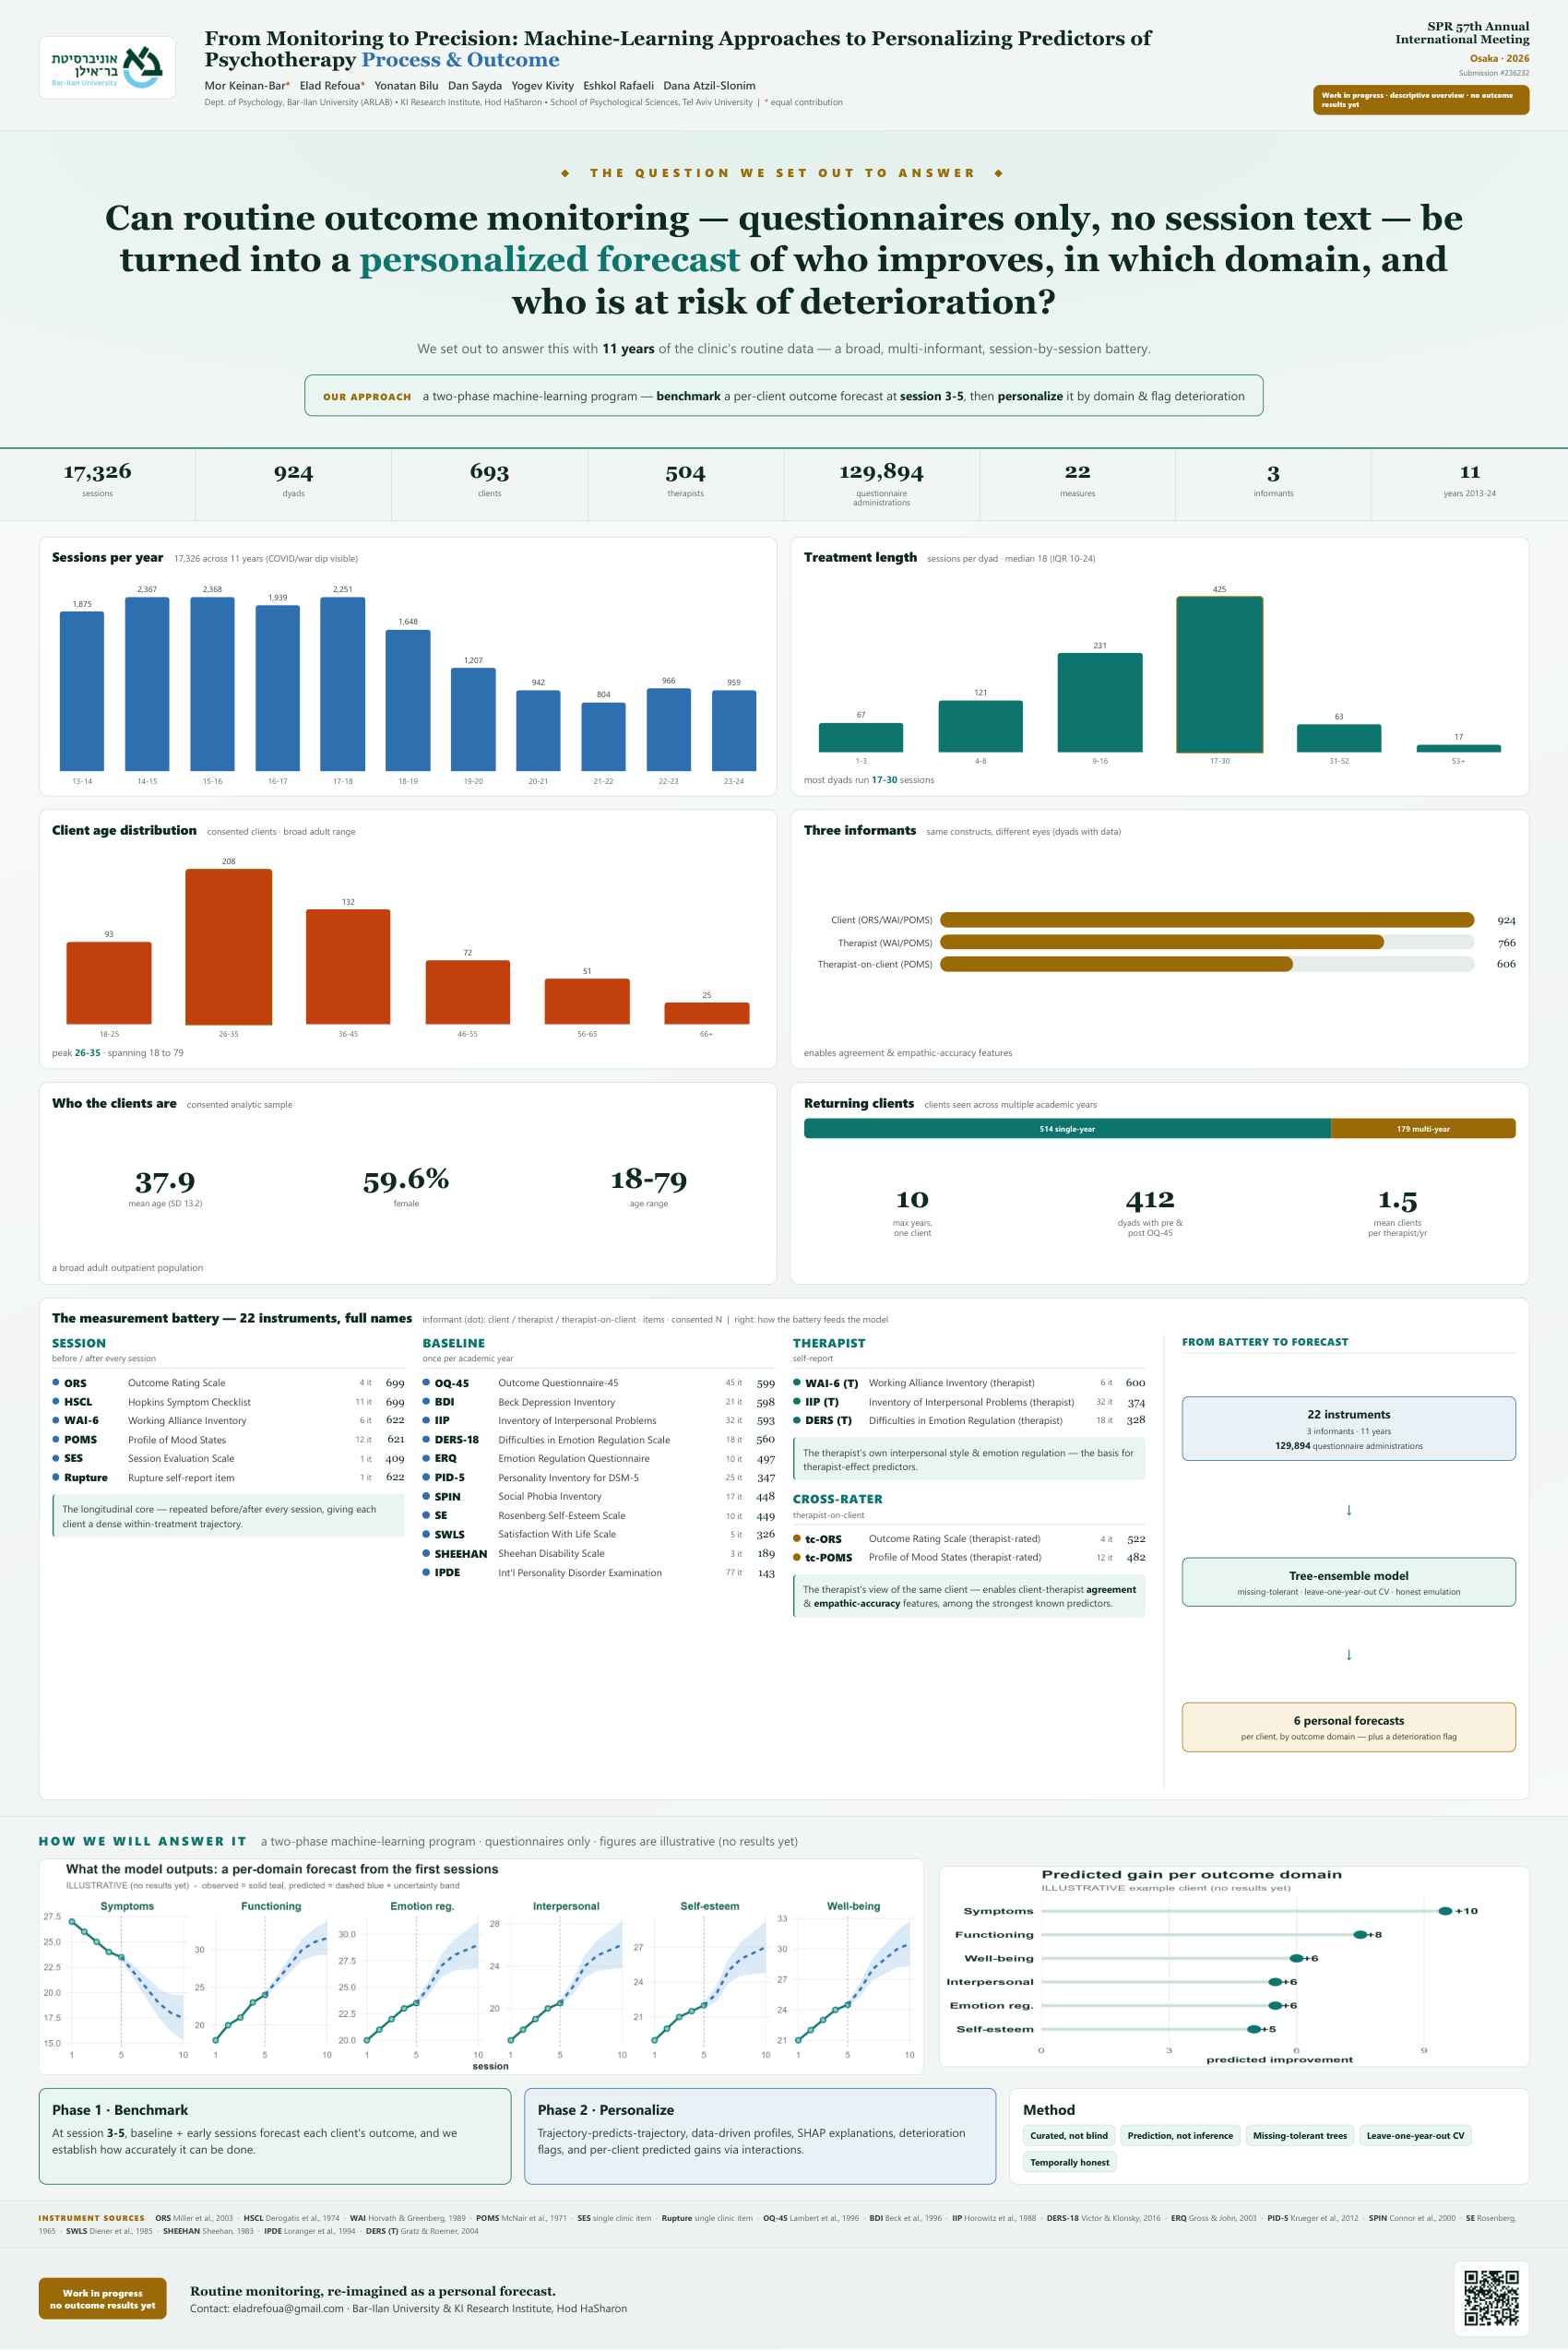
Forecast chart + a predicted-gains chart side by side, with a thin plan strip.
3 Pipeline diagram (battery->model->forecasts)
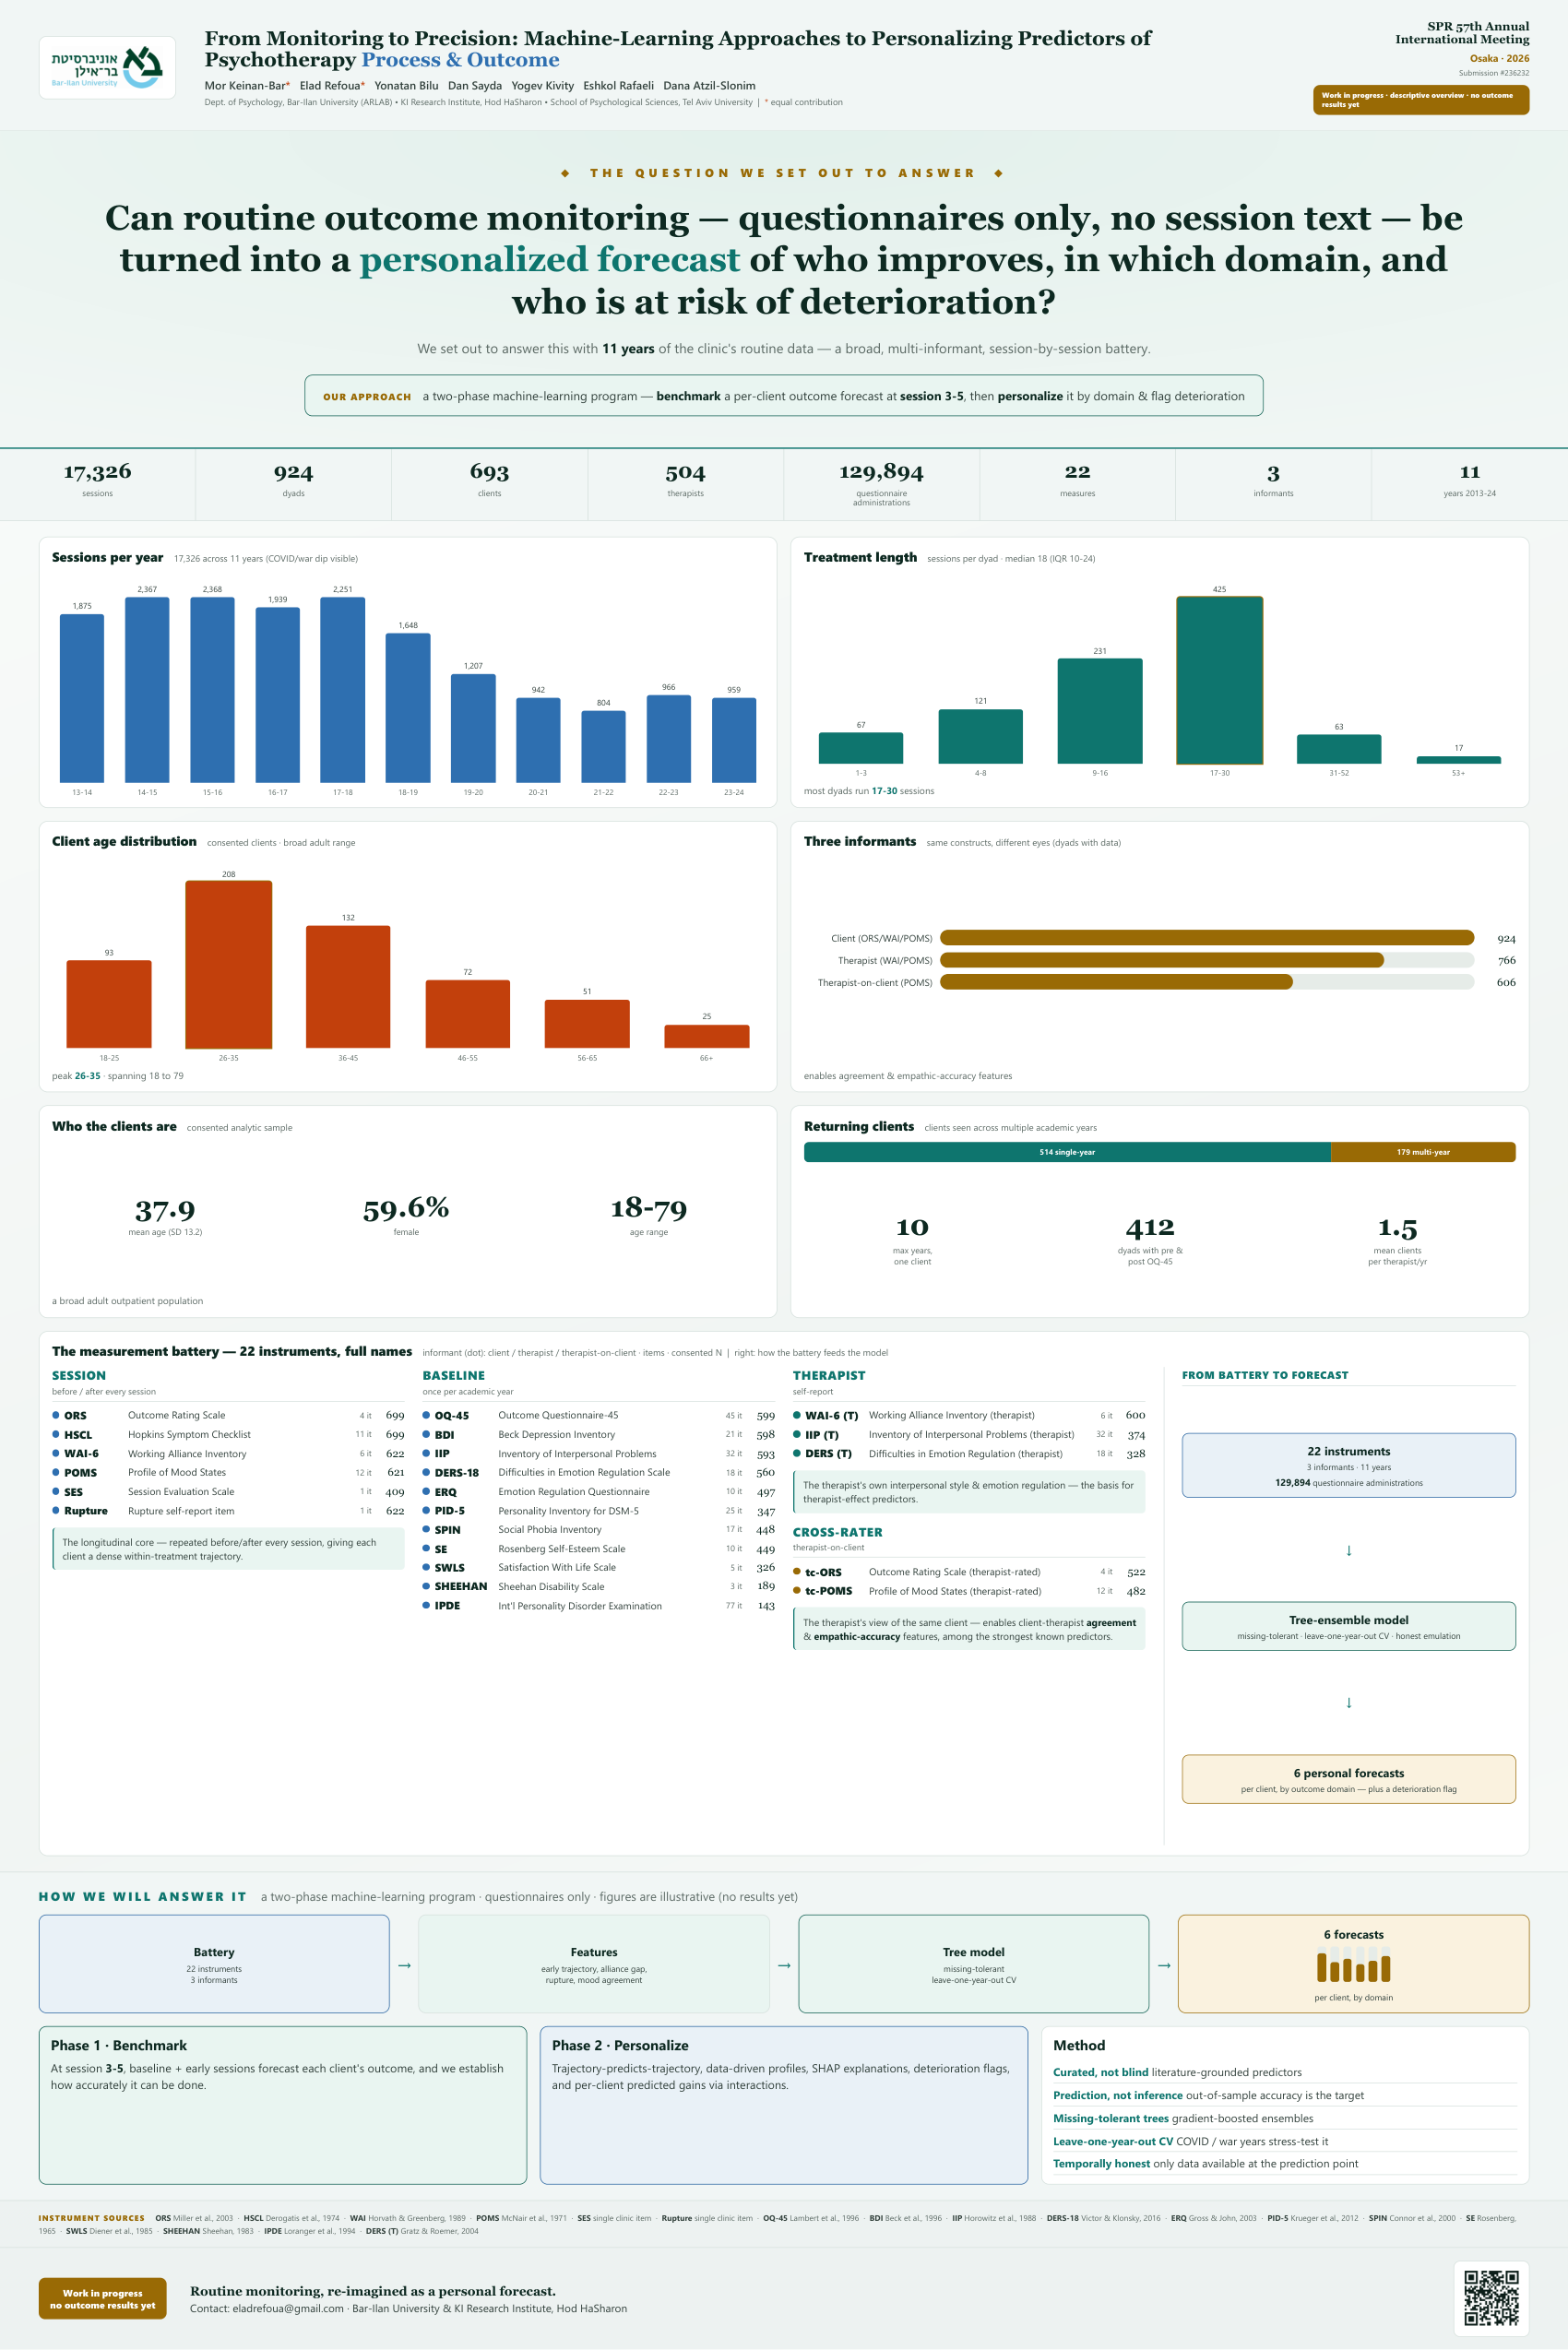
Pipeline diagram: battery -> features -> tree model -> 6 forecasts (with little output bars).
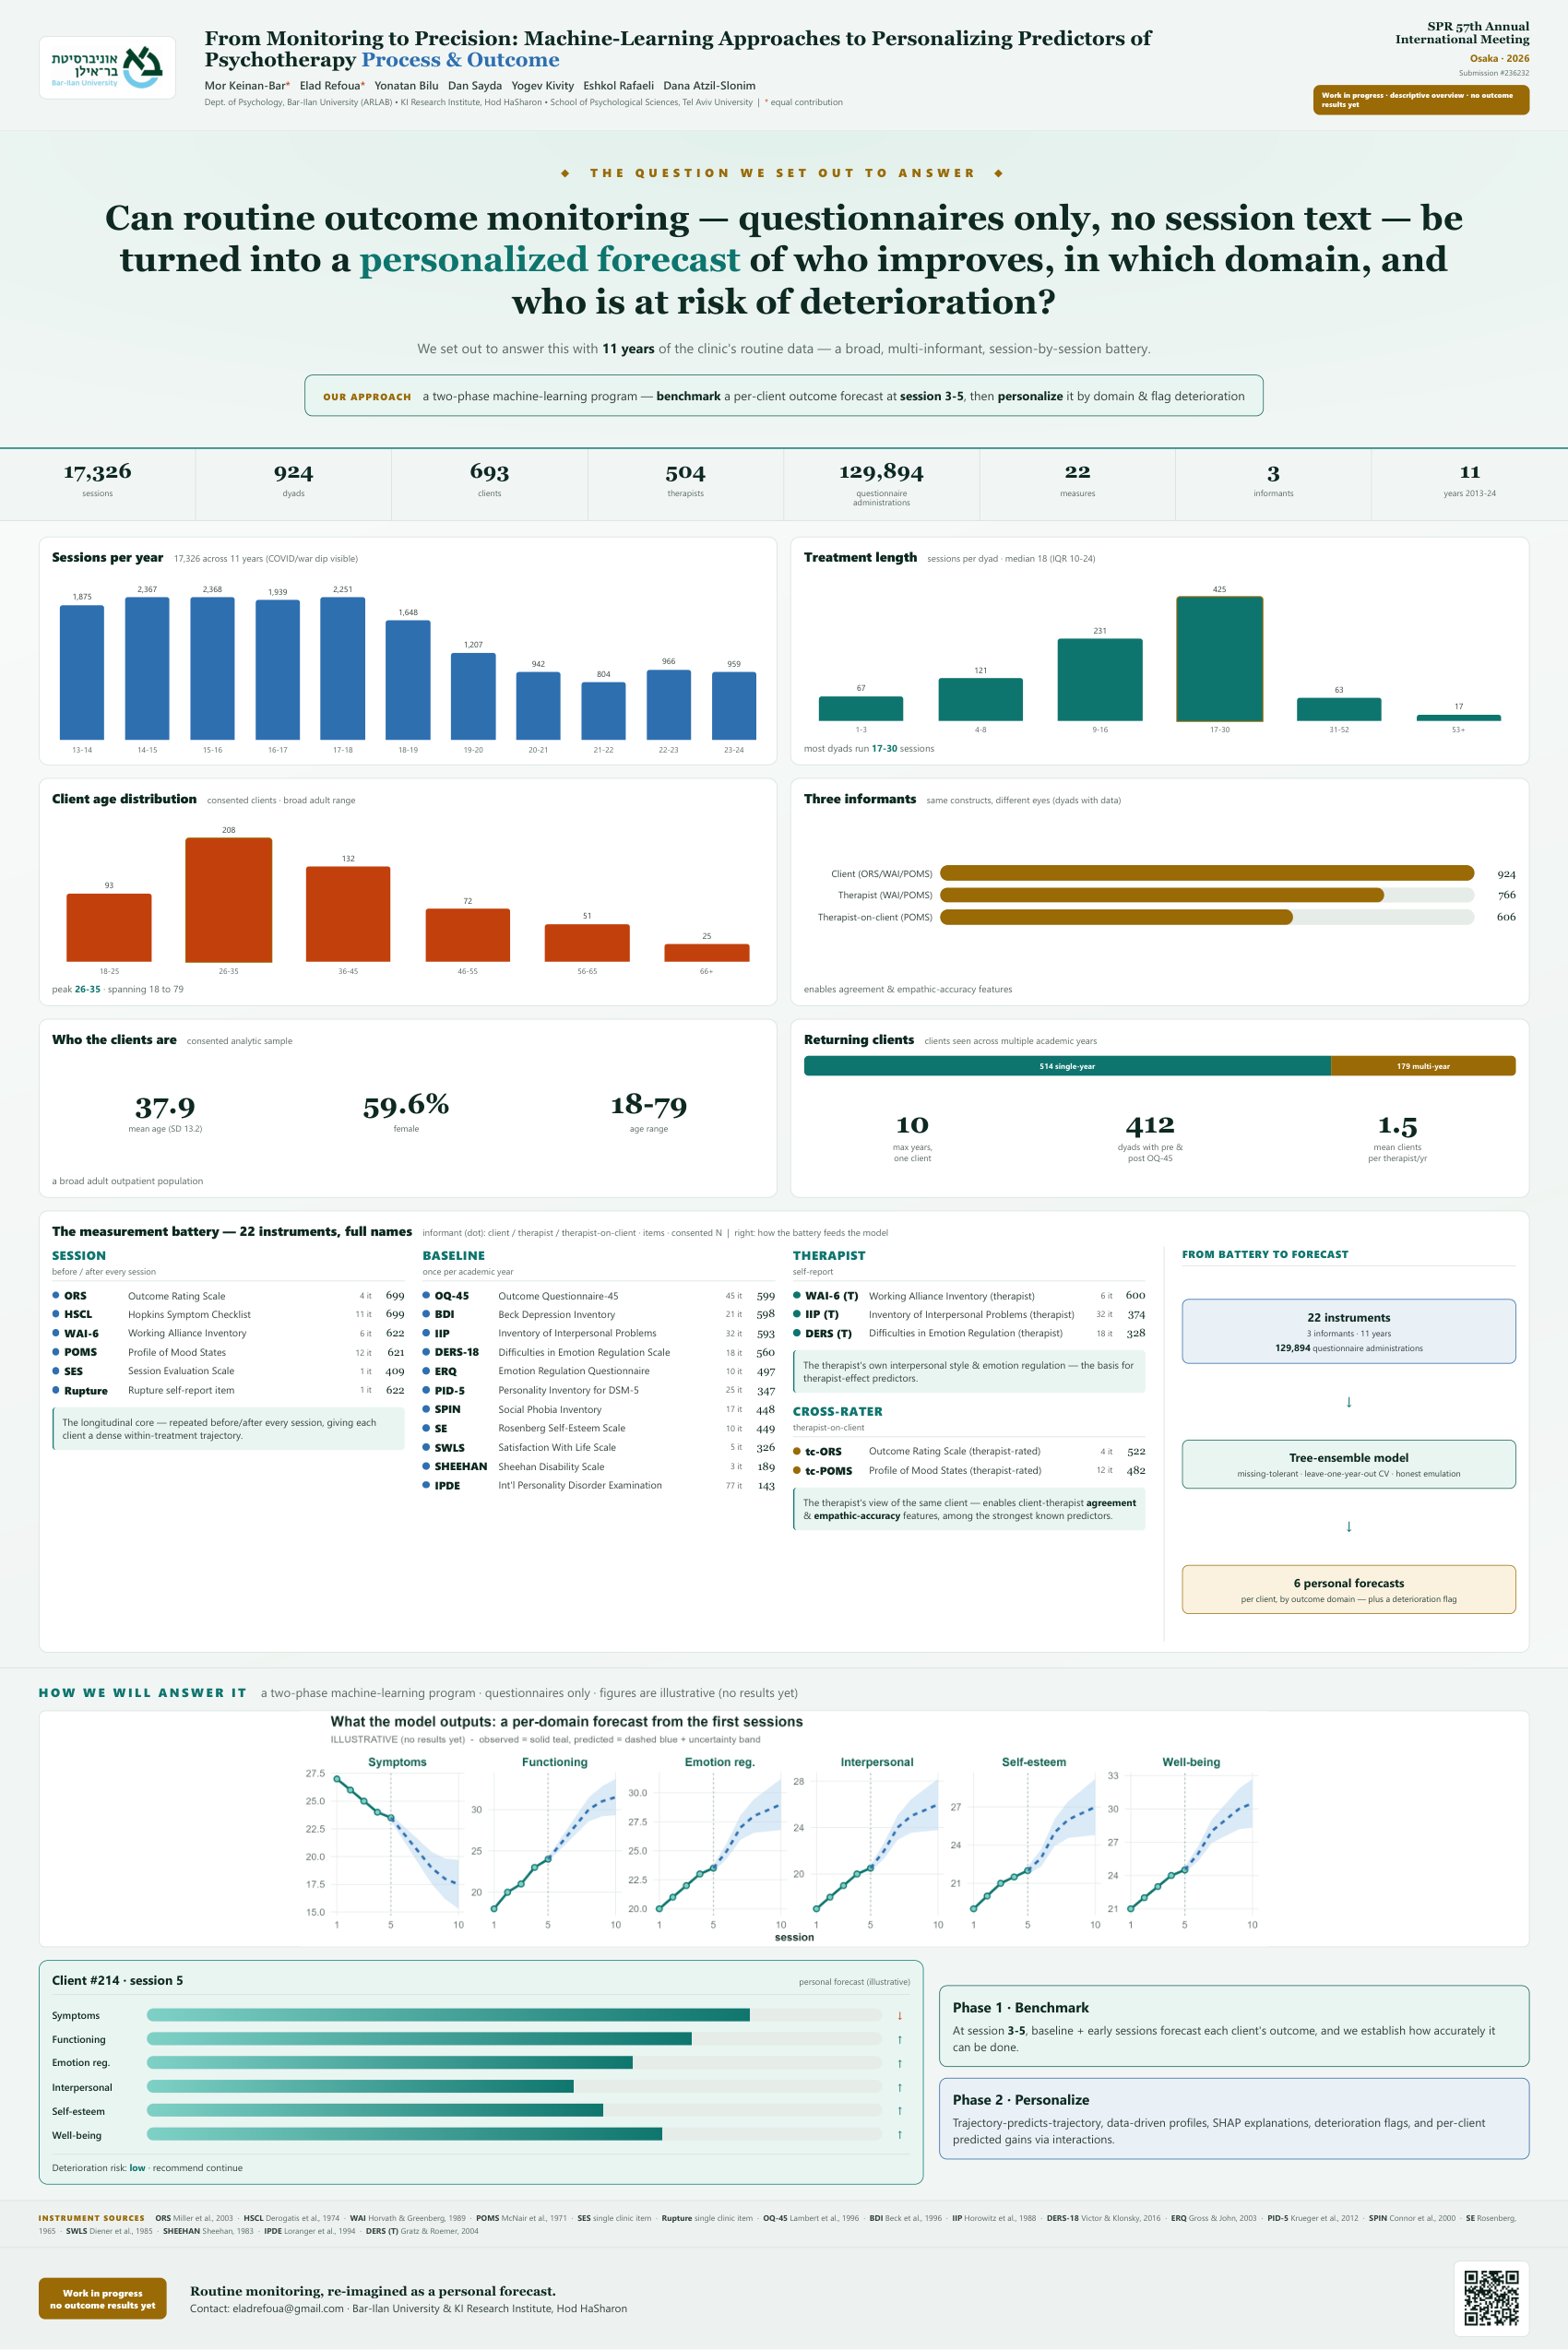
4 Clinician forecast-card mock + plan
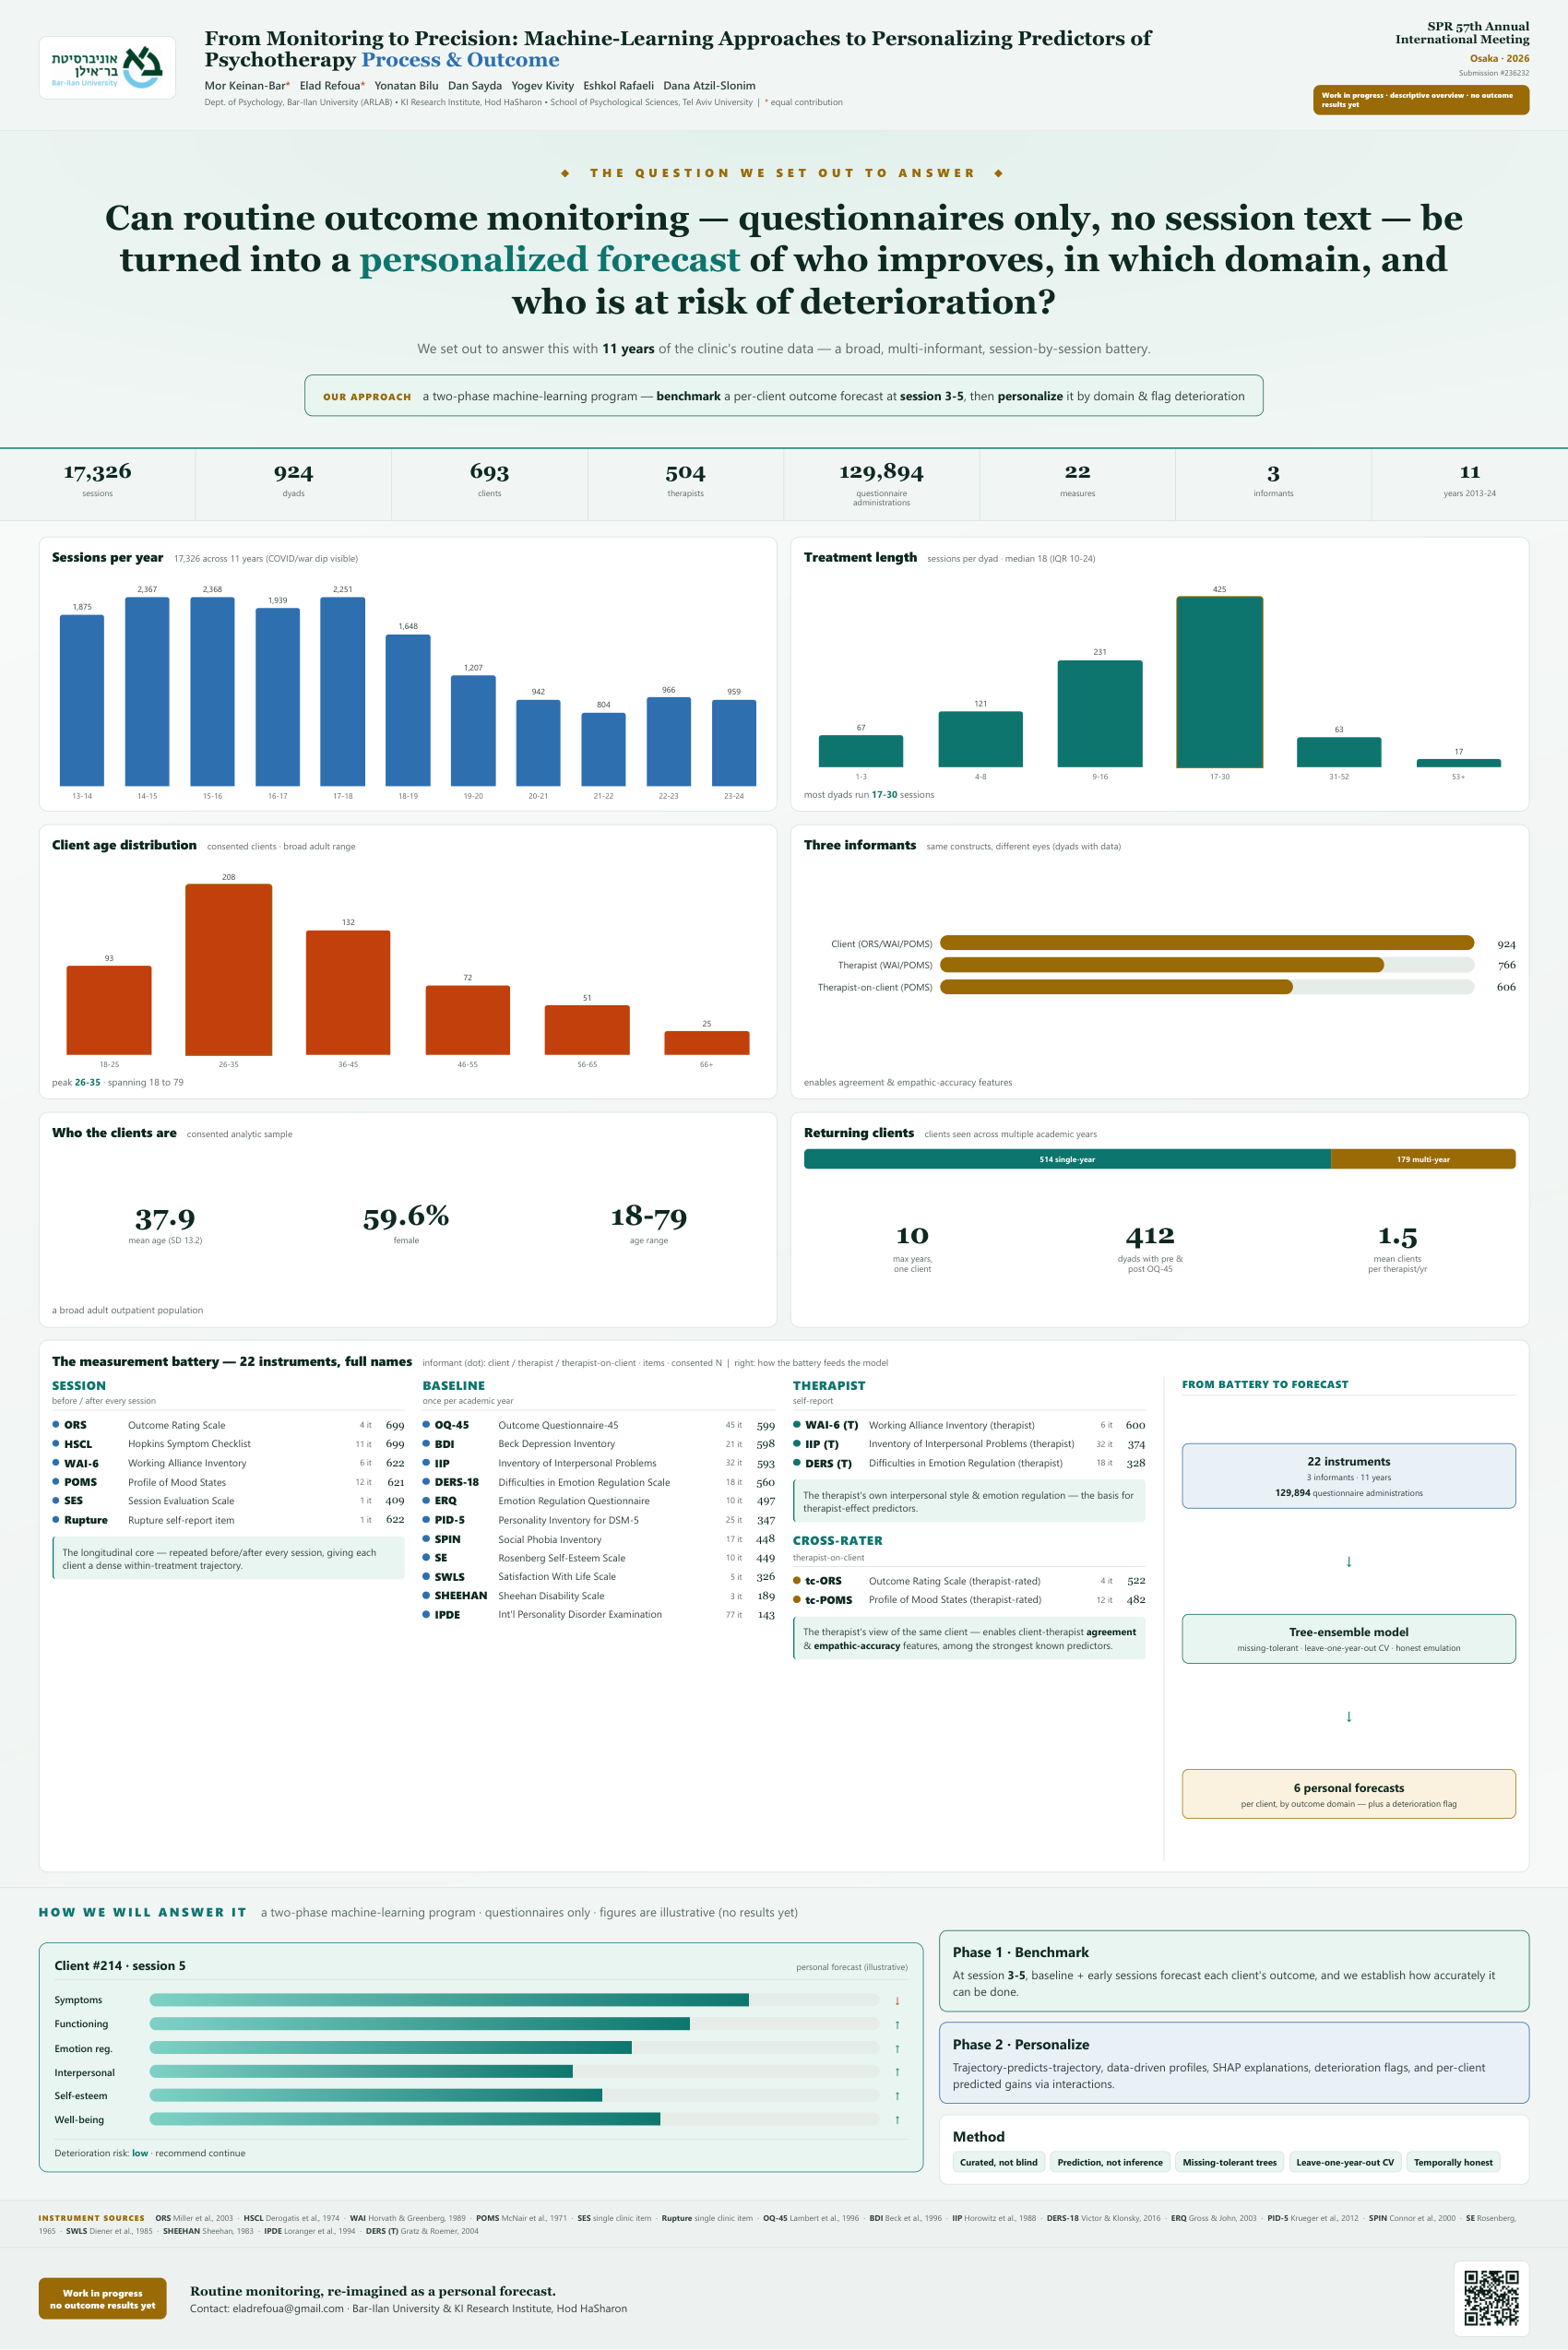
A mock of what the clinician sees at session 5 - per-domain predicted change + a deterioration flag - beside the plan.
5 Session timeline (predict @ 3-5) + plan

Session timeline marking PREDICT @ 3-5 and the observed-vs-forecast zones, with the plan.
6 Predicted-gains chart + plan/outputs
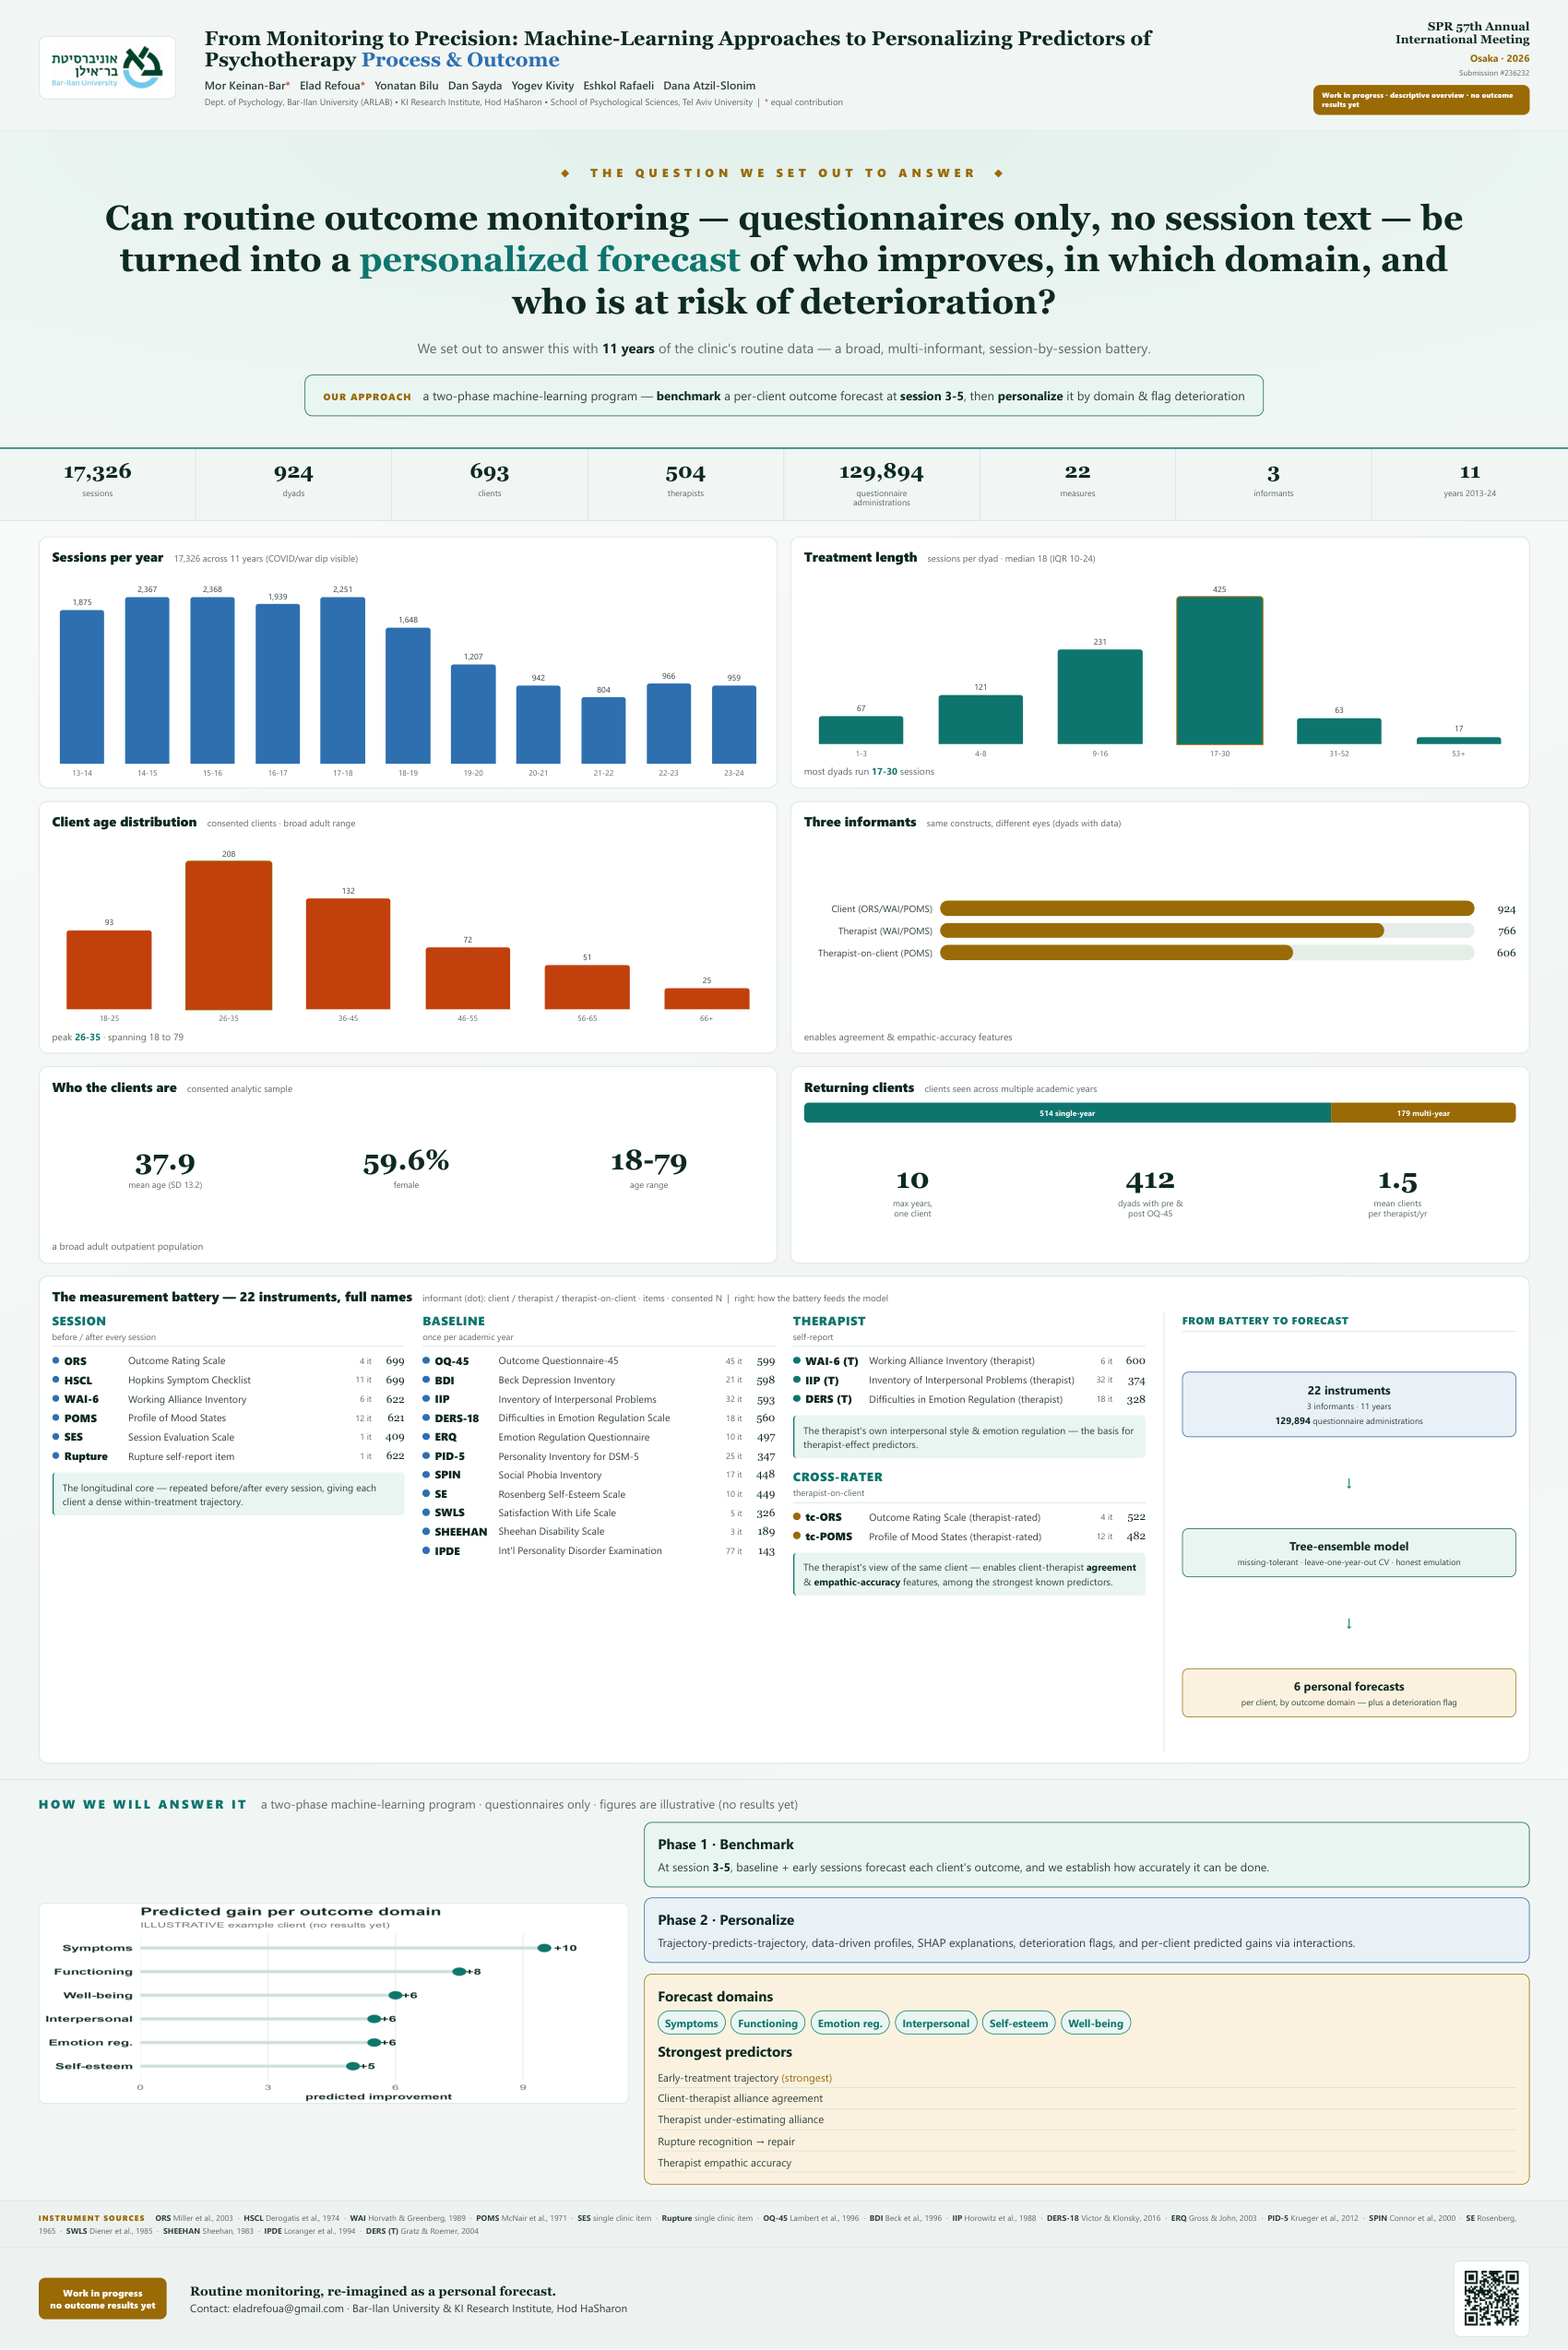
Predicted-gains chart beside the plan + forecast domains/predictors.
7 Two phases + full-width forecast chart
Two phase cards on top, a full-width forecast chart below.
8 Six domain gauges + plan
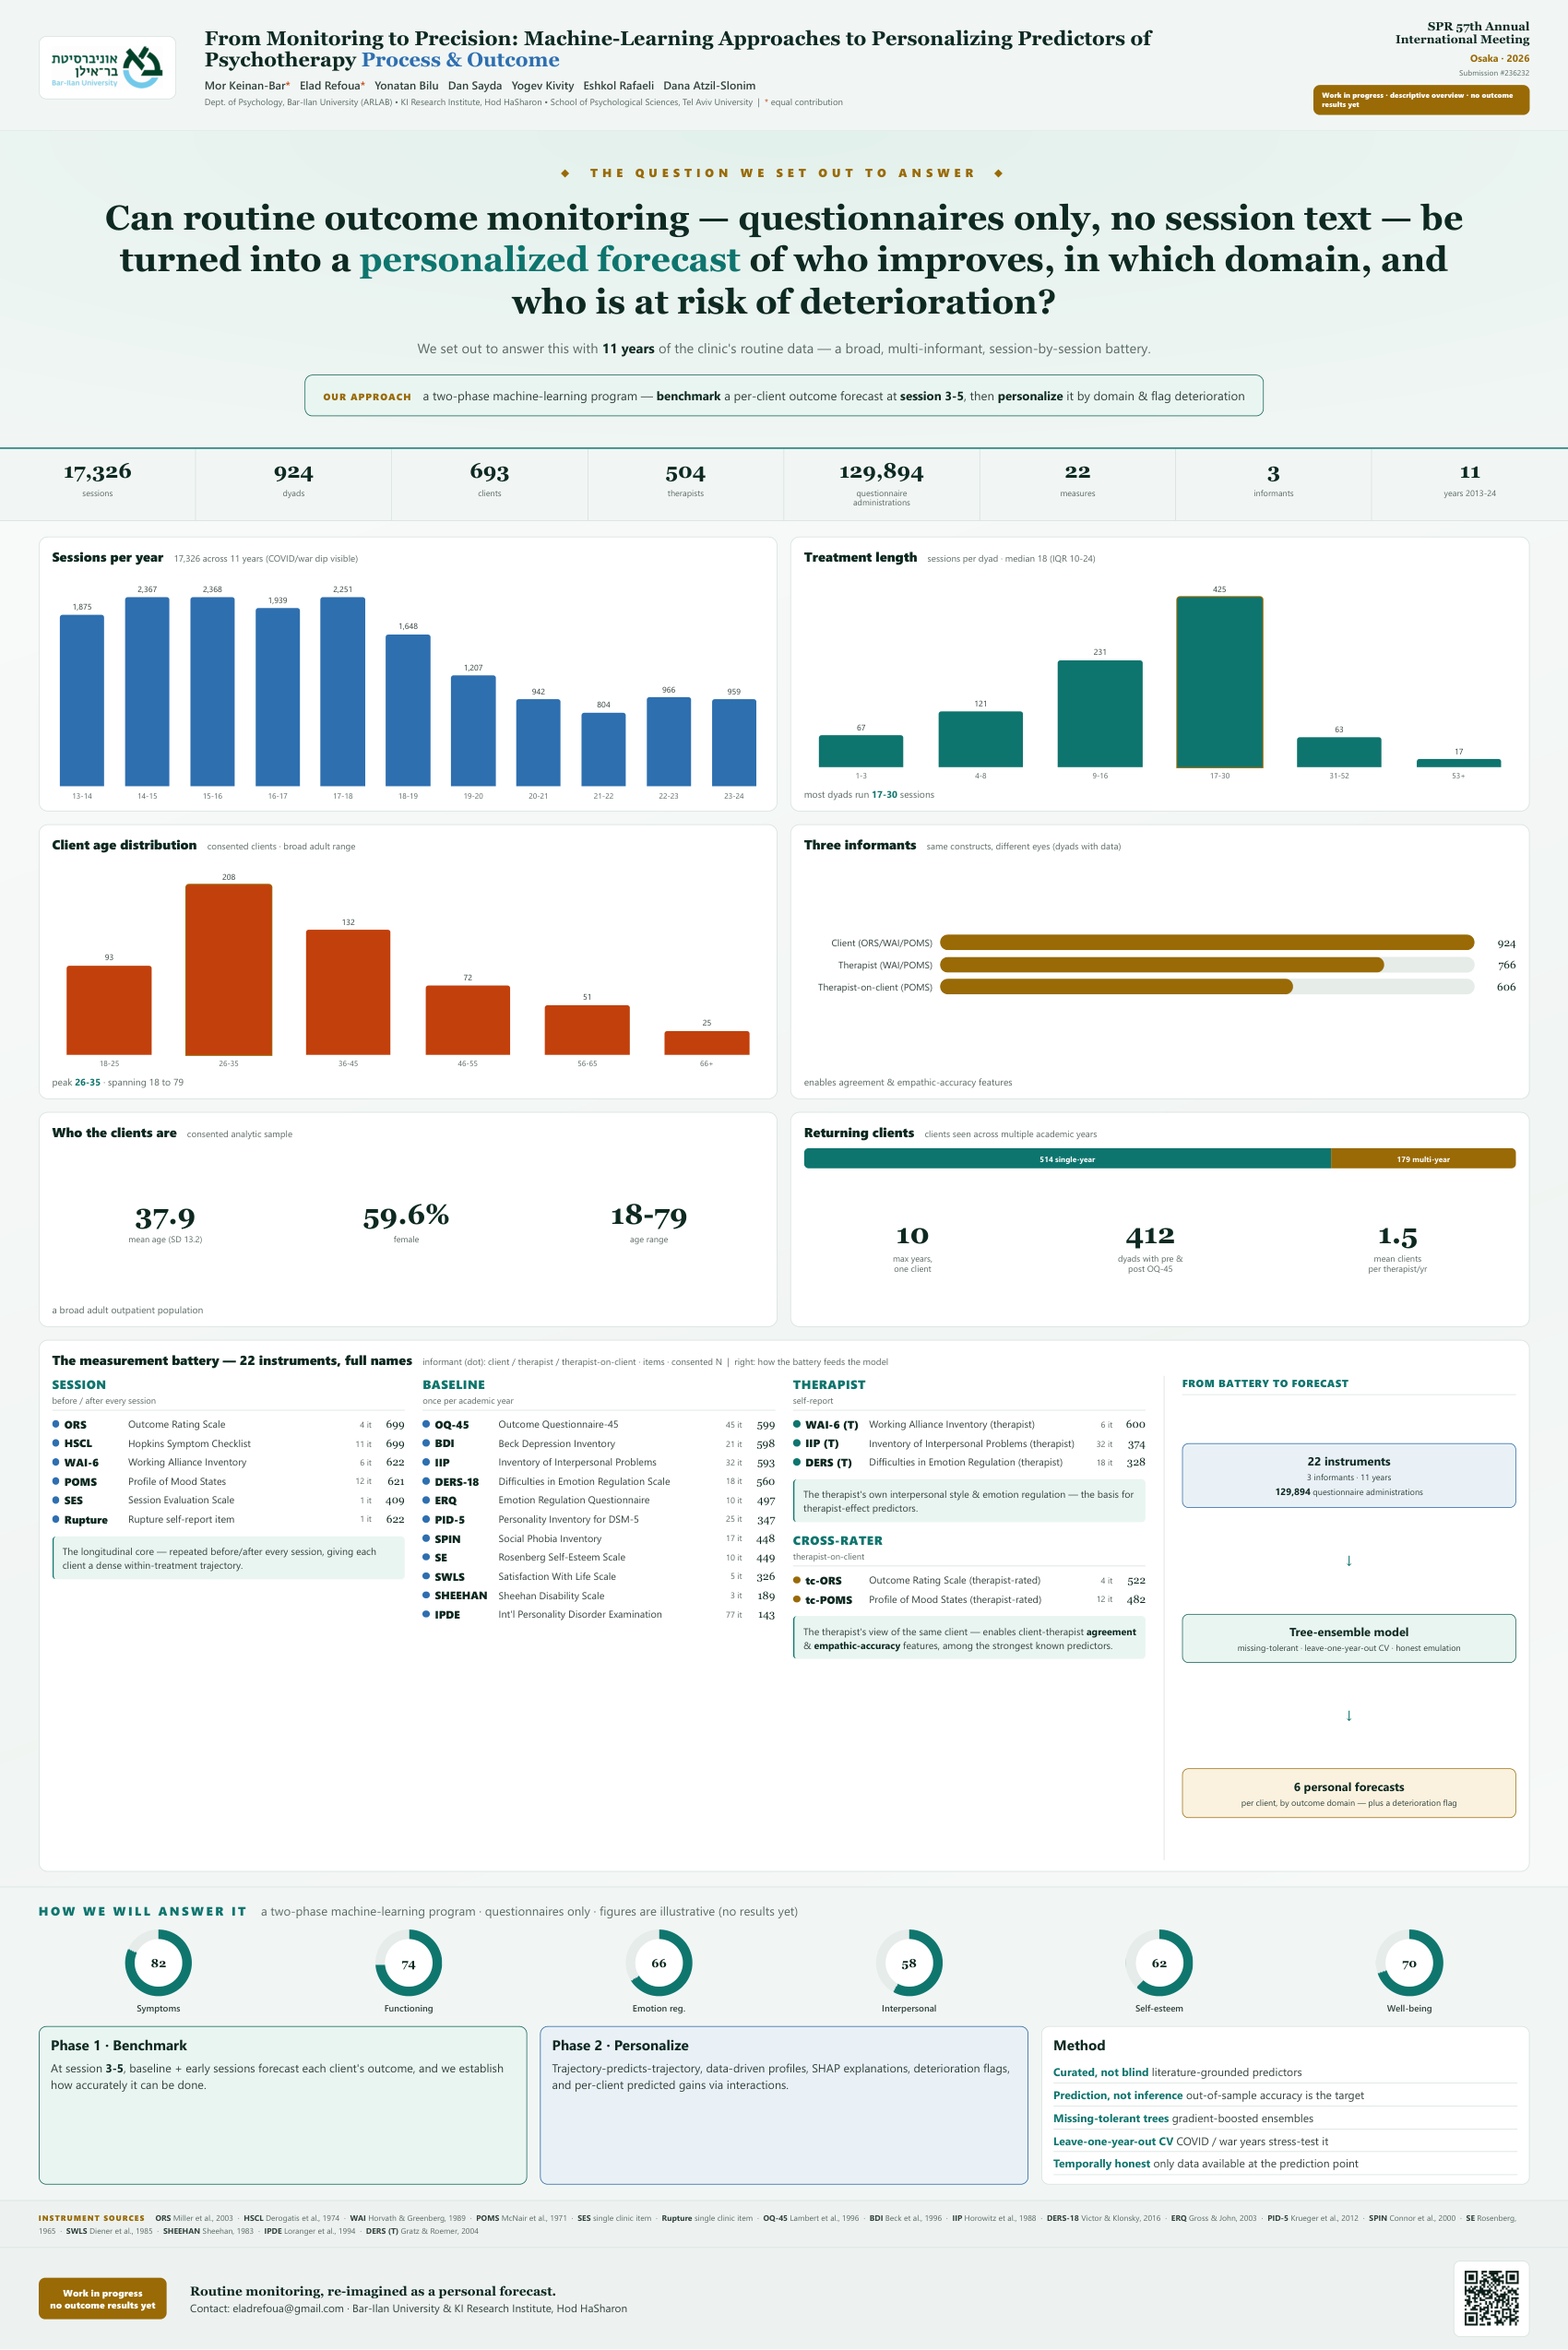
Six domain 'gauge' rings showing predicted gain, with the plan.
9 Forecast chart + clinician card (two visuals)
Two visuals stacked: the forecast chart + the clinician forecast-card mock.
10 Pipeline + predicted-gains combo
Pipeline diagram + predicted-gains chart combo.